


Advanced Certification Program in Data Analytics in collaboration with IBM
Course Highlights
About the program
Data comprises numerous categories of facts, such as numbers, words, observations, pictures, videos, etc. Data Analytics is the assortment, conversion, and organization of these facts that help to conclude, make predictions, and drive informed decision-making. It is the master key to opening the path to the success and growth of businesses, irrespective of their nature. Organizations need Data Analysts to sort through vast data sets to help make business decisions about their products, services, or strategies. This helps in maximizing their customer satisfaction ratio. This Data Analyst Course covers several tools and technologies that help achieve these requirements. It is one of the most sought-after professions in almost every industry.
This Data Analytics course, in collaboration with IBM, aims to master beginners and professionals alike in the in-demand set of skills that are critical to today's career opportunities.
Throughout this course, learners will have access to the following:
- Tools and technologies required to land them their dream job in Data Analytics
- A comprehensive curriculum with the latest industry know-how
- Sessions delivered by highly qualified and experienced Master Trainers from the Data Analytics spectrum
- Exposure to current and real-time industry trends and requirements
- Integrated, blended learning journey with live and learn-by-yourself modules
Our Data Analytics course with placement assistance covers knowledge in technologies such as Statistical Inference, Tableau, Python, Spark, Hadoop, Machine Learning, Seaborn, Matplotlib, Pandas and more, and other in-demand skills that will make you job ready in no time.
All sessions on technical skills and coding assessments will be conducted and evaluated online. During the training program, learners will work on capstone projects that will solve real-world problems. The knowledge and skills they gain working on projects, simulations, and case studies will place them ahead of the competition.
An expert-led course on Aptitude Skills worth INR 3000 is included in this course, absolutely free!
Businesses and organizations expect their employees to be proficient with numbers to deal with all kinds of numerical data on a day-to-day basis. Hence, recruiters always seek someone with the right set of analytical and logical thinking skills. It is an inseparable and integral part of most competitive exams like the GMAT, MAT, CAT, CSAT, etc. Companies like TCS, Wipro, Infosys, and Amazon routinely administer aptitude tests during interviews. Our learners will be trained in quantitative and logical, and analytical skills to ace these aptitude tests.
This course will,
- Help learners become a master of Data Analytics with Excel, R, and Python, which are highly recommended languages.
- Enhance knowledge of SAS, the most widely used analytics software.
- Help with learning and implementing Power Query and Power Pivot for Data Analytics.
- Cover the skills learners need to use Tableau in analytics, one of the most in-demand data visualization tools.
- Help gain knowledge in Machine Learning with Python and complete capstone projects to solve real-world problems.
We hope that you will gain the required knowledge from this program and demonstrate the skills learnt.
All the best!
Choose a Passport that helps you build a career of your choice.
Eligibility criteria


Syllabus
Syllabus
Uncover the top skills taught in our comprehensive course
Programming languages and tools covered


Housing Price Prediction

FIFA World Cup Analysis

Credit Card Fraud Detection

Marketing Campaign Effectiveness

Customer Segmentation and Personalization

Industry recognized certificate
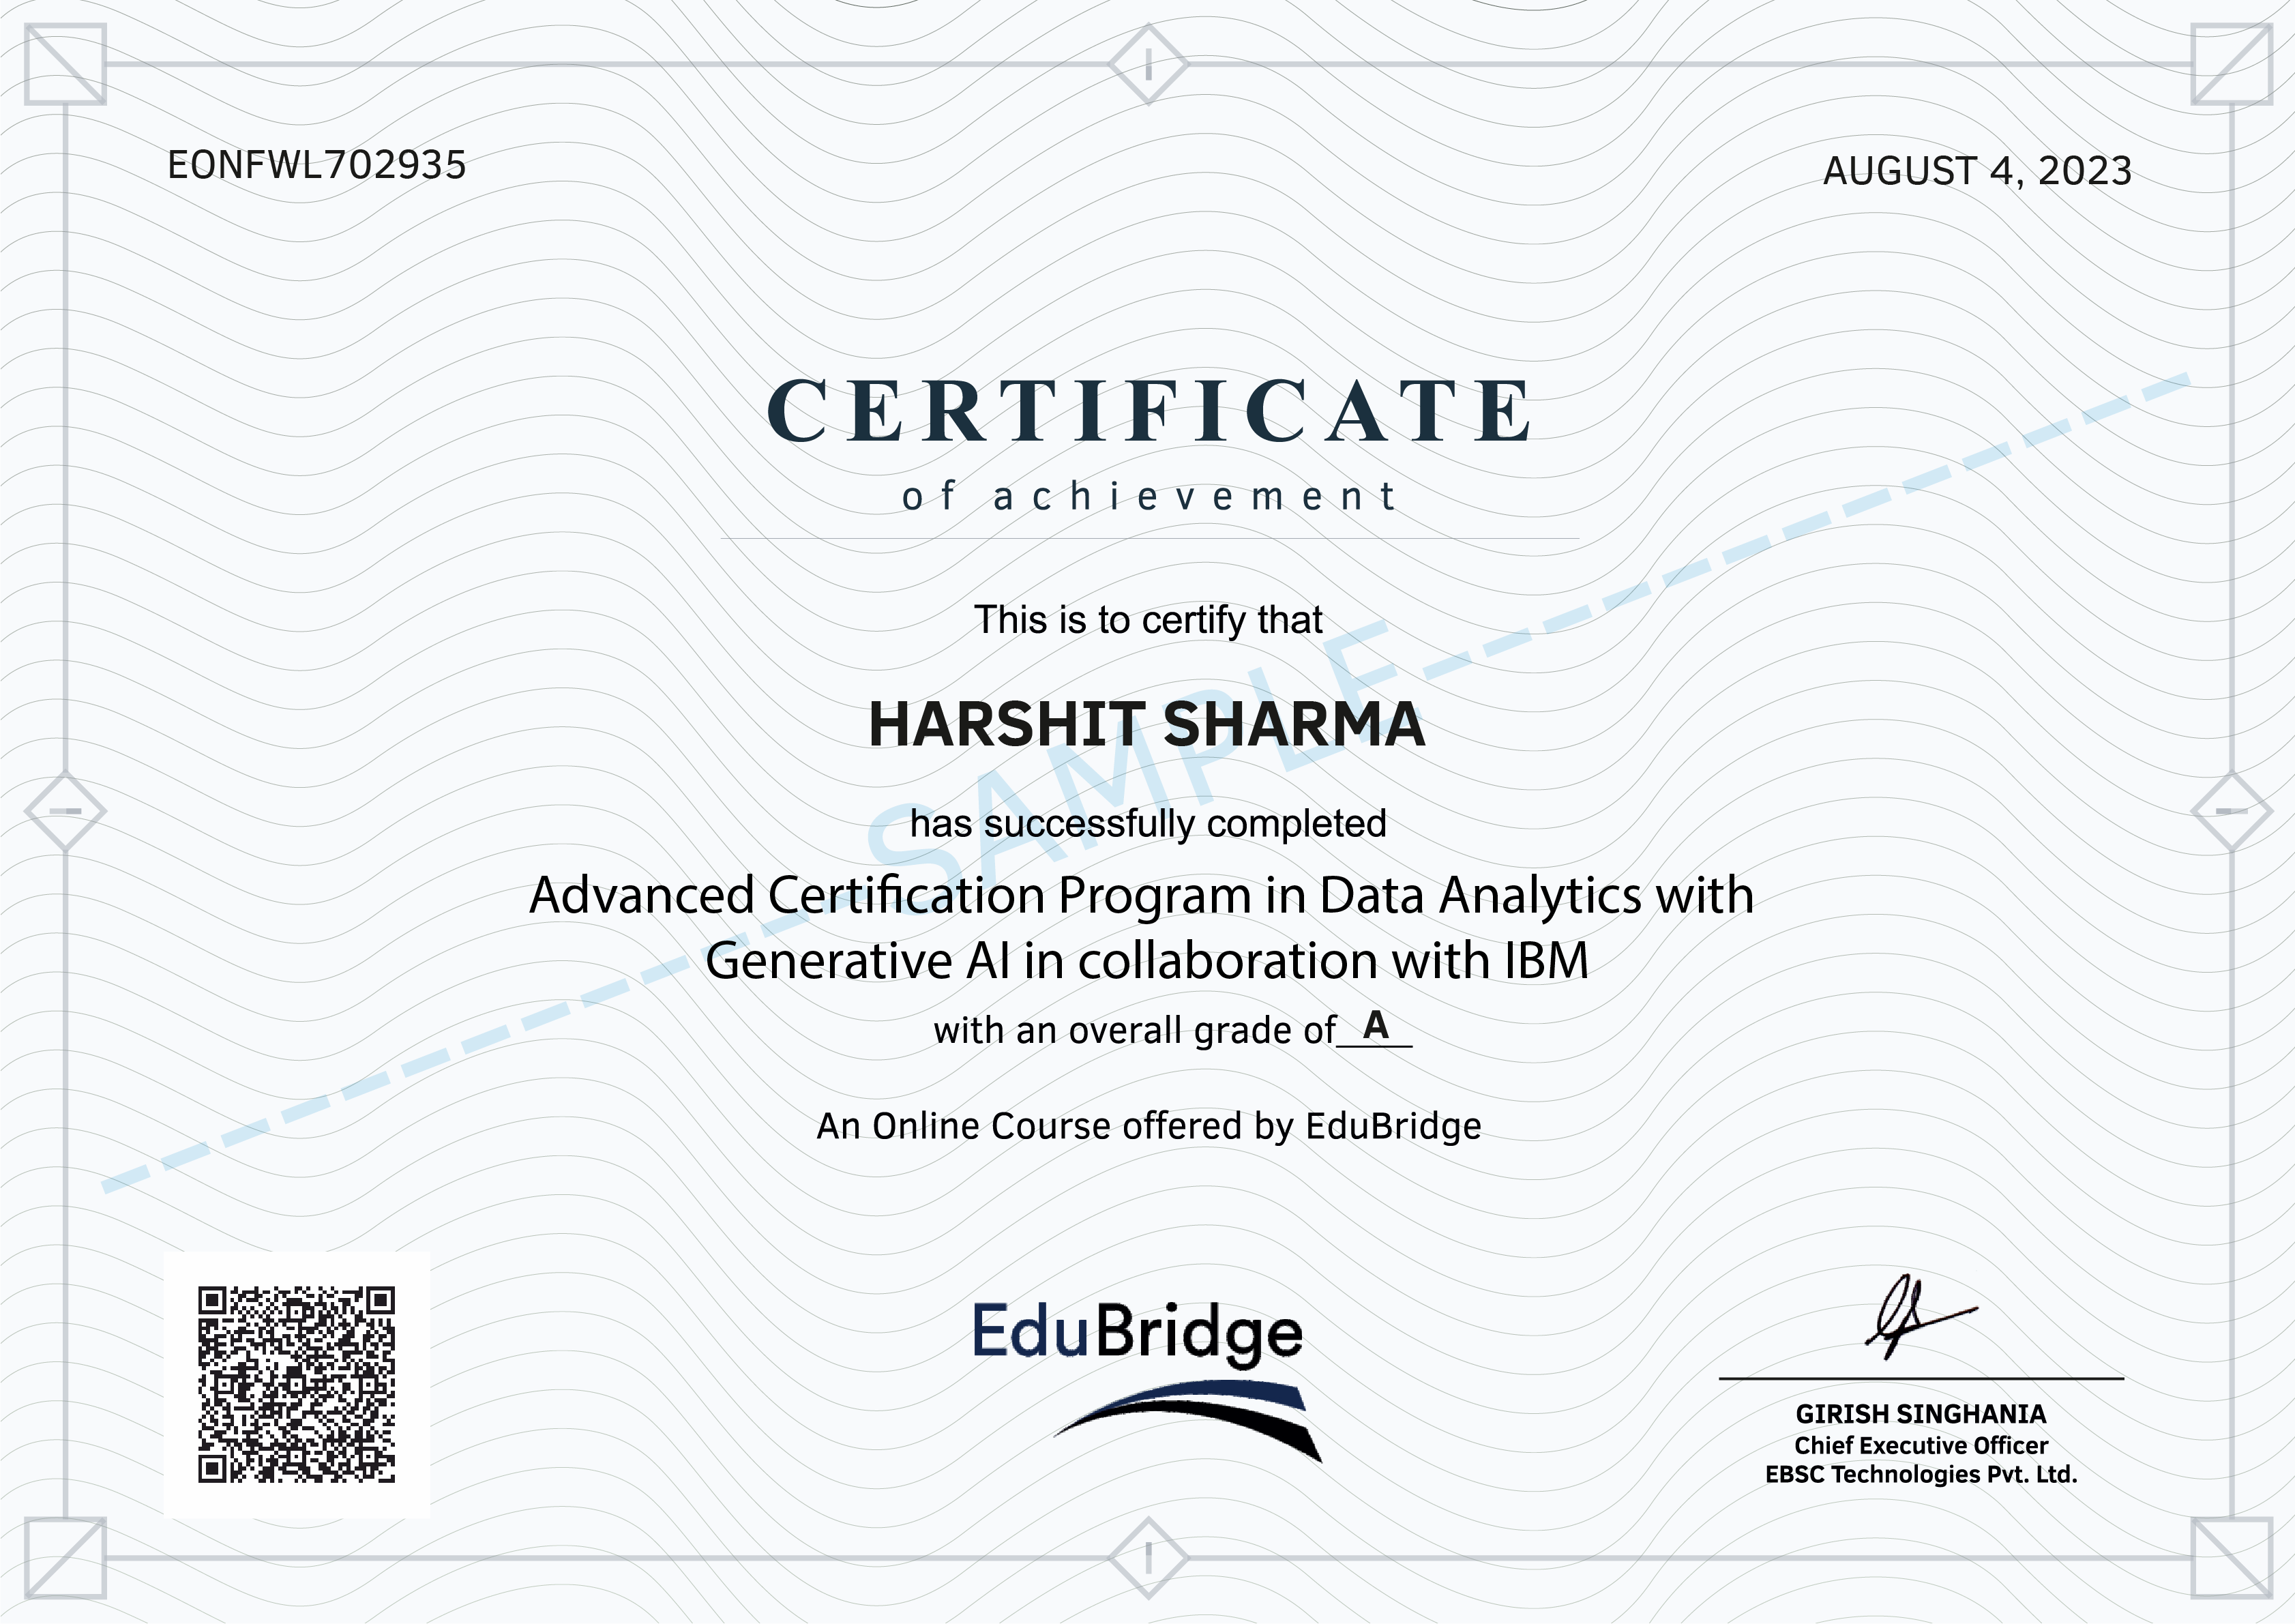
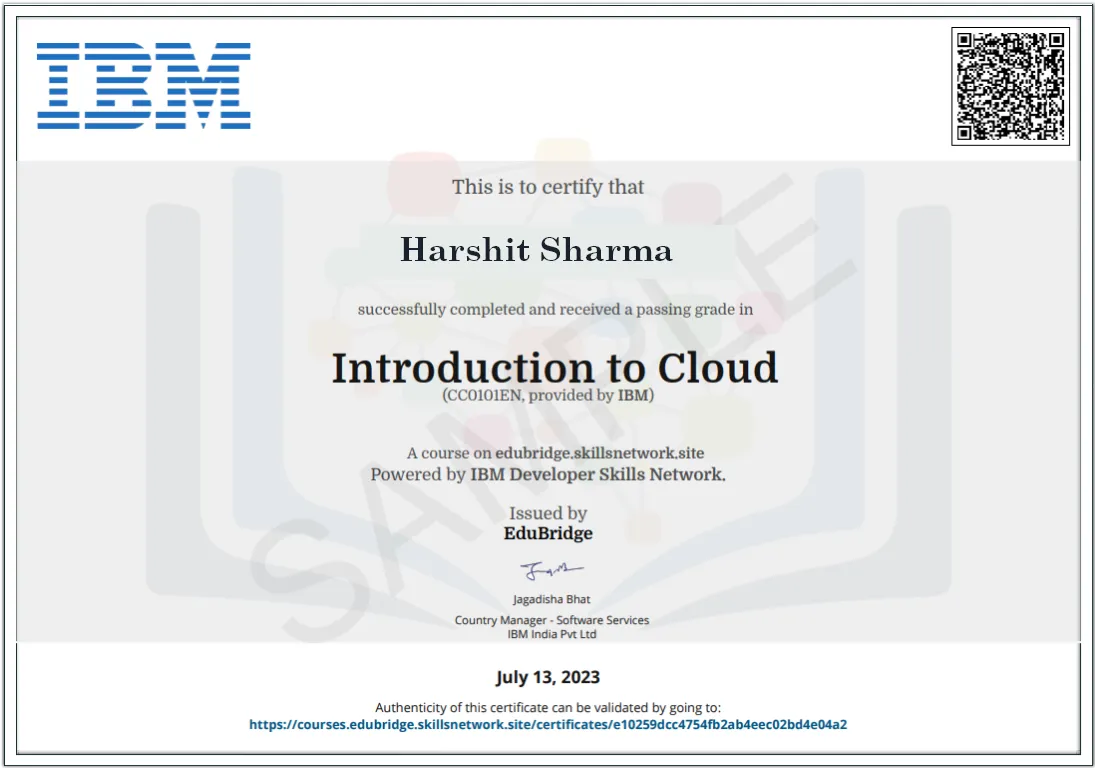
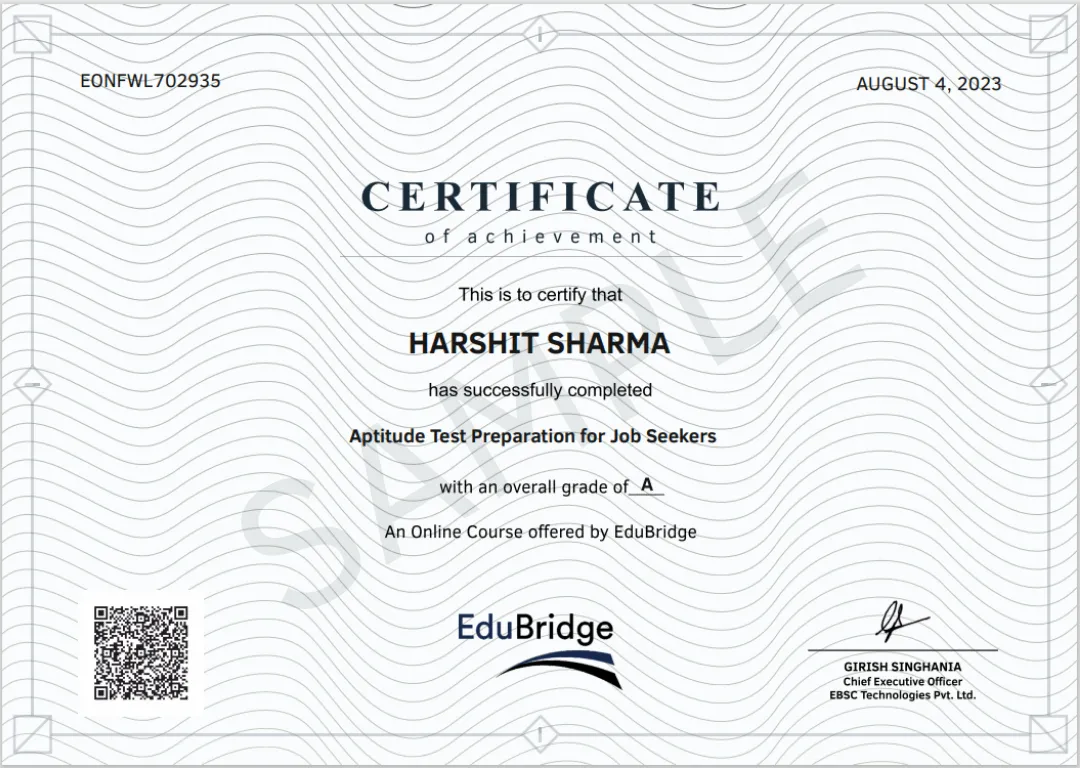
Earn your EduBridge Data Analytics course certificate, Aptitude Skills certificate and four IBM course certificates.
EduBridge offers an in-depth course designed to ensure our learners a pathway to jobs; these certificates are proof of mastery.
Learners will be awarded the Certificate of Achievement on satisfying the requisite attendance criteria and successfully clearing the assessments with a 50% score and above.
Our learners can share their Certificates on LinkedIn, Twitter, and Facebook, boost their resume, frame it, and tell their friends and colleagues about it.
Our course rating


Changing Lives, Transforming Careers
Frequently Asked Questions
To Know More About Secure Your Salary please visit: https://www.edubridgeindia.com/secure-your-salary
Yes, IBM badges are recognized globally by the global IT industry. Getting a certification from IBM may help in boosting and change a career. It is worth noting that the IBM data science professional certificate in Coursera claims that 26% of the enrolled learners have successfully started a new career after completing the course.
Yes. The course offers real-time coding problems and assessments that will help the learners get a hands-on-experience of the course contents and help them master the various concepts of Data Analytics.
Assessments are visible to you in the 'My Courses' section. Your Trainer will activate this post completion of the sessions. Once the Assessments are activated, you will get a notification on your 'My Calendar' option about the same.
Having an IBM certification can also help to stand out in a competitive job market, as it shows that one is dedicated to his/her career and has a strong understanding of IBM technologies. This can help the learner stand out from other job applicants and improve their chances of getting hired.
At EduBridge, we are committed to delivering top-quality interview services to our learners. Our team works diligently to match learners with suitable interview opportunities in alignment with their skills and preferences. However, unforeseen circumstances can sometimes arise that may prevent us from fulfilling our commitment to provide interviews to the learner. In the unlikely event that we are unable to secure an interview opportunity for the learner, we offer a refund of INR 30000* on the Job Passport and INR 15000* on the Interview Passport. • Eligibility for Refund: The learner will be eligible for a refund if we have been unable to arrange interview opportunities as mentioned in the Terms & Conditions*. • Amount of Refund: The amount as mentioned above of INR 30000 and INR 15000 will be subject to full fees being paid by the learner. In case a learner has been awarded any discount on the course fees during enrolment, the said percentage of discount would also be adjusted during the refund. For example – Course Value is INR 80000 and during enrolment, learner was awarded a discount of 10% and therefore the net fees paid was INR 72000. In this situation, 10% would be deducted from the refund amount as well and in case refund situation arises, the amount refunded would be INR 27000 (for Job Passport) or INR 13500 (for Interview Passport). • Refund Process: To initiate the refund process, the learner must submit a written refund request to wecare@edubridgeindia.in. The request should include the learner's full name, contact information, and enrolment details. • Processing Time: Once we receive a valid refund request, our team will review the case and process the refund within 30-45 working days Refund Amount: The refund amount will be issued using the same payment method used during enrolment. • Non-Applicability: The refund policy will not apply if the learner falls into any of the criteria which make the service void. This has been detailed in the terms and conditions section as well. Please note that this refund policy is designed to provide a fair resolution in cases where we are unable to fulfil our commitment to secure an interview opportunity. We remain dedicated to assisting our learners to the best of our abilities and aim to achieve successful outcomes for all learners. If you have any further questions or require clarification regarding our refund policy, please do not hesitate to contact our customer support team.
We have a dedicated calendar section on the Learner Portal. Here you can see your planned classes at least a month in advance. We also send out e-mails and SMS as reminders.
You must have a minimum of 70% attendance in the online classes to be able to utilise the services offered under the Interview Passport and Job Passport programs.
IBM skills are recognized and valued worldwide, so an effective way to easily share knowledge and expertise with the professional network is essential for the career growth of our learners.
We follow a blended training approach here at EduBridge. There will be a mix of live trainer-led sessions, some videos with voiceovers and pre-recorded videos that are learn-by-yourself mode.
Receive a prestigious Certificate of Achievement upon successful completion, validating your expertise to employers and peers.
Don't worry! You can attend weekend doubt-clearing sessions, which are topic-based classes conducted by our Senior Subject Matter Experts. You will receive regular invitations and notifications on the portal, WhatsApp, or email.
You will be required to submit your PAN card, AADHAR details, Marksheets of 10th, 12th, and Graduation, Supporting educational certificates and any other requirements as mandated by the recruiters.
If the learner has work experience in a different field than the course they are enrolling in, they will be considered freshers and not as having relevant experience. Only relevant work experience in the said course is considered as a work experience learner in any course.
If an IBM exam is not completed successfully on the first attempt, there is no waiting requirement before taking the test a second time. However, candidates may not take the same test more than twice within any 30-day period.
We hope that such a situation does not arise as we offer you 3 upcoming schedule options to choose from, so we hope you choose wisely. In an unfortunate event, when you do need to change the batch, you can request a batch change before you attempt the Entrance Level Test. You can change a batch only once in the lifetime of the course.
We at EduBridge, do not provide recordings. However, learners can access training content with voice-over on their Learner Portal.
Elite Learner's Club is a loyalty program for our learners that will offer continuous learning through our various services. Click here for more information: https://www.edubridgeindia.com/refer-and-earn
Data Analytics is a discipline focused on extracting insights from data, including the analysis, collection, organization, and storage of data and the tools and techniques used to do so. The chief aim of data analytics is to apply statistical analysis and technologies to data to find trends and solve problems. Data analytics has become increasingly important in the enterprise to analyze and shape business processes and improve decision-making and business results.
A Bachelor’s degree, preferably in Mathematics, Statistics, Computer Science, or related fields is with a minimum of 50% (or higher) if required for anyone to enroll in this course. Being familiar with Statistics, core Math concepts, programming basics (Python, R, or Java), and Linux fundamentals would be an added advantage.
IBM certification is considered to be a great way to demonstrate technical skills and knowledge to potential employers.
This course covers Python, R, and SAS for data analytics and manipulation. It includes pandas and SQL for data analysis, Tableau and Excel for data visualization, as well as machine learning and big data tools like Spark. Hands-on experience with all these technologies is provided.
Excel is used in data analysis because it’s easy to learn and use. Its functions like vlookup, xlookup, pivot table, and analysis tool pack make it the most widely used tool by any analyst position like data analyst, business analyst, or business intelligence analyst.
We cover 4 modules of IBM in this course, and they are Predictive Analytics Modeler, Data Science, Artificial Intelligence Analyst, and Introduction to IBM SPSS Modeler Text Analytics - Text Analytics. Please note that IBM believes in keeping their courses 100% relevant to the market trends, so they may archive/update the modules without any prior notice. In such a case, the EduBridge team will update the latest modules in the course curriculum and deliver the same to our learners.
Yes, the expert trainers at EduBridge will conduct online training for the IBM courses and ensure that the learners earn relevant badges. They will also get guidance on using the same on their resume and social media profiles. We follow a 60-40 approach in all our courses, so 60% of the training is led by the trainer and 40% of the course has to be completed by the learner.
Explore Related Courses
Broaden your horizons with our diverse courses; whether you're looking for related subjects or new interests, we have options to enrich your learning journey.

Advanced Certification Program in Data Science and Data Analytics in collaboration with IBM
 4.4 stars by 5112 learners

Certification Program in Data Analytics
 4.7 stars by 5103 learners

EMI options available
| Steps | Actions |
|---|---|
| Age | Between 21 and 59 years |
| Employment | Businessman or salaried person |
| Monthly Income | Minimum of ₹18,000 per month (salaried/business) |
| Documents | Valid Aadhar card, PAN card, income proof, and other relevant documents needed for the EMI process |
| Co-Applicant | If not eligible, earning parents/siblings can be the earning co-applicant for the EMI application |
Need any help/clarification? Call your career coach on toll free number 18001201193
| Steps | Actions |
|---|---|
| Step 1 | Select "Pay Later" with the relevant EMI partners while processing payment online on Razorpay. |
| Step 2 | Add your PAN number and complete your KYC. |
| Step 3 | Choose your payment tenure and make your first payment. |
| Steps | Actions |
|---|---|
| Step 1 | Pay the registration fee/ down payment on Razor Pay. |
| Step 2 | Submit your or the applicant's ID proof, address proof, and income proof on your learner portal online or connect with your onboarding counselor for any assistance. |
| Step 3 | Complete the EMI process from application to disbursal. |

Already have an account? Login or create new Account